Thursday, August 31, 2006

Hong Kong air ticket price war? SIA joins in the fray with $368 offer, but hours later...

.... Cathay slashes prices to as low as $300 to match Valuair's price. Mr. Lau from Valuair is confident that budget carriers can survive even if the full-service carriers flex their muscles. 'It does not matter whether it is a budget carrier or a full-service airline. Competition comes from all sectors. … Valuair's costs are lower and we will definitely give them a run for their money.'

a) Distinguish between fixed and variable cost and discuss why costs might be lower for the budget airline compared to the full service airline. [10]

In the short run, when a firm is doing business, it will encounter costs. These costs can be divided into two categories: fixed and variable costs. Fixed costs are defined to be factor input costs incurred in the short run (SR) which even at zero output, will be incurred by the firm. Variable costs, on the other hand, are defined as costs of factor inputs which can be altered in the SR.

Hence, in the SR, fixed costs are constant regardless of output while variable costs change depending on the amount produced.

Total cost in the SR is given by fixed cost plus variable costs.

The advent of budget carriers in Europe and the US, and now Asia, has been mainly due to the lower costs incurred by budget carriers, thus they are able to offer lower prices to attract the more price conscious consumer. There are various reasons for this lower cost.

Many fixed and variable costs have become lower. Budget airlines may land at smaller airports which charge less landing fees. Budget carriers also do not provide many services such as in-flight meals, movies, blankets, peanuts, etc., thus reducing fixed costs (some of these may be considered variable too). Their airplanes do not always dock at the gates either and this reduces airport fees as well. Free seating also means there is less administration costs during issuing of tickets.

However, because budget carriers tend to be smaller than conventional national carriers, they may experience less economies of scale than their bigger rivals and thus incur higher average costs. But their success in European and American markets does seem to indicate that full service airlines have all along been overcharging consumers, and only now, feeling the heat of the competition, are they reducing prices which come from the exploitation of such economies. Yet on the other hand, bigger full service airlines may also experience diseconomies of scale and thus incur higher costs.

Overall though it does indeed seem that budget carriers' cost savings are much more than such diseconomies, thus they are able to offer lower prices in the end.


b) Comment on possible strategies the CEO of a budget carrier might adopt if it wishes to try to increase his firm's profits. [15]

Before analyzing the possible strategies, it is necessary to make qualifications with regard to the air travel market. For simplicity's sake, let this discussion regard only to economy class air travel. First and business class air travel may exist, but such price discrimination practices are not part of budget airline's strategy, so it is alright to leave that sector out for the moment and focus on the average traveller.

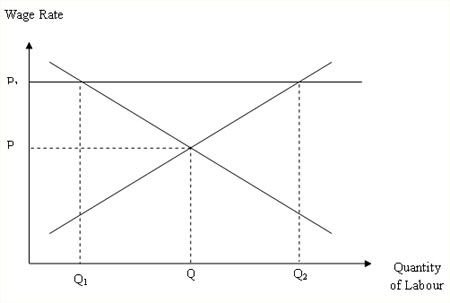
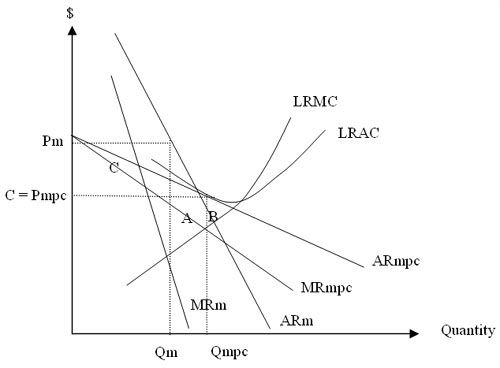
The market structure of the economy class airline industry can be said to be an oligopoly. Even though this analysis is only taking into account economy class tickets, the product may not be homogeneous. There are also only a few players with regard to a particular route and there are considerable barriers to entry (eg. buying an airplane is out of reach for most entrepreneurs). Thus, the market will adhere to the kinked demand theory as shown below.

The demand curve is kinked in such a way if the firms in question are competitive, which is a safe assumption in the given example. Ceteris paribus, consumer demand, revenue and other factors are held constant in the SR. Assuming profit maximization (at MC = MR) and rational behaviour by firms, the price and quantity of airline trips should stabilise at P0 and Q0 respectively (point E). This is because if a firm were to increase price above P0 (should its marginal cost (MC) curve shift up beyond point A), then it will sell less as other oligopolistic firms, being competitive, do not follow suit. Thus, demand above point E is price elastic. However, if the firm decreases its price below P0, all other firms would follow it in an all out price war. Thus, demand below E is price inelastic since for the individual firm, a price cut will just mean all competitors follow suit, and the increase in quantity demanded will be shared across all airlines.

In general, if firms profit maximise at MC equal to marginal revenue (MR), then for any MC curve cutting the MR in between points A and B on the MR, the price and quantity produced will be at P0 and Q0 respectively.

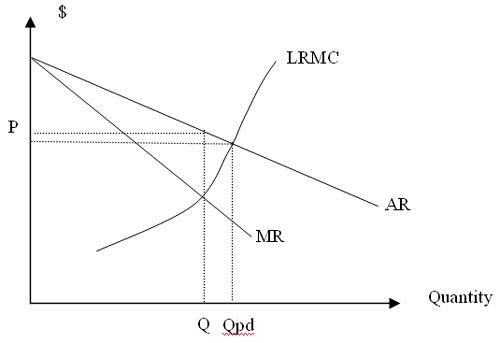
In order to increase profits, it is therefore necessary to shift the average cost (AC) and MC curves down in the form of price competition. This is shown in the diagram. Originally, with AC1 and MC1, the firm's profit is the shaded grey region. If AC1 and MC1 shift down to AC2 and MC2, profit increases by the shaded green region. Total profit increases to P0EDC2.

To lower the AC curve, there are many measures an airline can take. It can cut down on services provided during flights as what the budget carriers have done. It can dock at secondary airports or not dock at the terminals to decrease landing fees. Other cost cutting measures include increasing labour productivity, cutting wages of aircrew, not providing certain services (such as food and onboard entertainment) to flyers, and finding more fuel efficient ways to fly. Such measures would decrease average costs overall by cutting back waste. This will in turn increase profits by shifting down the AC curve as shown in the diagram.

However, once the MC reaches point B, it is up to the firm to decide whether to instigate a price war. If it does, so, the kink on the demand curve will shift down and this may actually cause a fall in profits, should AR fall below AC. Within this concept of game theory, it also needs to consider whether it will be able to cope in the long run or fizzle out and become bankrupt. Hence, the uncertainty of the market structure may cause firms to in fact not want to maximize profits at MC = MR due to the unanticipated responses of other oligopolies.

In the shorter run, firms may want to engage in non-price competition. Advertising can increase demand and price elasticity of its product. It may emphasize the differences of its airline against its rivals and differentiate its brand, thus increasing demand for its airline. It may also want to start a frequent flyers program to encourage loyalty of consumers and offer them discounts.

These are just some of the strategies that an airline can adopt. However, they may not be all that good. They should be applied with the competitors' responses in mind.

In reality, it is difficult to gauge the kink in the demand curve and firms are likely not to know which point of production actually maximises profit. Due to these uncertainties in the theory itself, it may not accurately reflect real world circumstances. Firms may also have alternative aims such as revenue or sales maximisation or multiple satisficing aims. Other problems such as principal-agent diversions must also be taken into account.

Income inequality has risen here in the last 10 years but it is a necessary evil for economic growth.

a Comment on the above statement. [10]

Rising income inequality is a phenomenon experienced by many developed and developing economies globally; Singapore is not an exception. In fact, Singapore’s Gini coefficient, a measure of the level of inequality in an economy, has risen from approximately 0.43 to about 0.47 in the past decade, confirming the first part of the statement: income inequality has indeed risen in Singapore.

However, what is more uncertain is whether income inequality is necessary for economic growth; to address this issue, one needs to consider how income inequality is related to growth. In particular, the magnitude of the inequality present is of great relevance. It is only after considering these factors will one be able to draw a semblance of a conclusion about whether, firstly, income inequality is ‘evil’, and secondly, whether it is necessary for economic growth.

Rising income inequality is often experienced together with economic growth, of which Singapore’s economy is a prime example, having grown steadily at a rate of about 6 – 7% in the 1990s. The presence of income inequality arises because of a difference in wages and income, which further arises because of, among other things, an increased demand in expanding sectors in the economy as compared to decreased demand in contracting sectors, resulting in higher wages in the former, as well as, more subjectively, an increased work effort.

Hence income inequality diverts resources to where demand is highest (as workers seek to increase their incomes, they look for jobs in the expanding sectors of the economy), and provides an incentive for workers to increase their work effort, hence increasing the productivity of the economy in general.

Hence some level of inequality does seem necessary for efficiency, and hence, growth in the economy.

However, high levels of income inequality can hinder growth. Income inequality arises for reasons other than those mentioned before; in particular, income inequality may arise because of inherent differences in ability or differences in inherited wealth.

Income inequality that arises because of these reasons are more likely to persist in the long term, and if present in large amounts, has the potential to cause social unrest and a lack of social cohesion because of rising discontent in the lower income classes. This will necessary hinder economic growth as it causes instability, and may reduce the confidence the world has in the at economy; Singapore, luckily, has as yet not experienced something that serious.

Income inequality is sometimes regarded as an evil purely because of ideological reasons; however, too much of it is also an evil in the economic sense since it hinders growth. Yet, some level of inequality is still necessary for economic growth.

3b) Discuss whether the minimum wage law is the best policy in helping low income earners in your country. (15)

The minimum wage law is an artificial floor on wages that attempts to raise wages of low income earners to more acceptable levels.

Photobucket - Video and Image Hosting

In imposing a minimum wage that firms must pay for labour, the government is legally assigning a minimum value of wages (P1) as the feel the equilibrium wage rate (P) is too low. However, while individuals who retain their jobs benefit, there are many (Q – Q1) who lose their jobs as producers find them too costly to hire. Furthermore, there is disequilibrium unemployment as Q2 workers want to work but only Q1 workers are wanted.

In trying to help low income earners, if the Singapore government puts in place a minimum wage, they might instead be doing the exact opposite for some of these workers. This is especially so as the market structure of the Singapore economy is very much a competitive one rather that that of say, monopsonies.

Instead, perhaps the government should look into alternative measures to help these workers. As most of Singapore’s unemployment is structural, perhaps the government should look into retraining these workers instead. Although this might be costly, the government can count, to some extent, on increased tax revenues from these workers who earn higher wages in the future, to finance this expenditure. Furthermore, this would solve Singapore’s structural problem directly to some extent, which is certainly desired.

One must also not forget welfare policies, Welfare benefits funded by progressive taxes on high income earners could be used to increase the income of the low income earners. This, unlike the minimum wage law, does not create unemployment. However, while this way of redistributing income is beneficial in this sense, progressive taxes are a disincentive on high income earners from working harder, whereas welfare benefits might serve to discourage low income earners from taking up an available job as they have a safety net to fall back on. These problems are not easily solved, and hence this method of helping low income earners require careful thought before being put into place.

The government, then, might want to cut regressive taxes to ease the tax burden on these individuals. They can also subsidies essentials such as rice and electricity alongside retraining policies. While this has little impact on income inequality, at least the low income earners are truly being helped, unlike in the case of the minimum wage law that distorts the labour market and brings along allocative inefficiency with it (refer to Q2 – Q1).

Tuesday, August 29, 2006

Free Trade Agreements and Singapore

a. Explain the economic justifications for the signing of free-trade agreements between Singapore and her trading partners. [6]

  • 'Explain': Make clear, give reasons for, elaborate on (i.e. go beyond stating reasons)
  • 'Economic justifications': Economic reasoning or 'motivation'
  • Application: between Singapore & trading partners
  • The small domestic market and the lack of resources: a strong need for Singapore to broaden its trading links beyond its own boundary and S.E.A; i.e. gain greater access to global markets (export-oriented nature of Singapore's economy); and to more and cheaper sources of imports (import-dependent economy).
  • Abolition of tariffs and non-tariff barriers on our exports: significant savings of several million dollars in import tariffs on our exports, enabling our exports to be more price competitive compared to neighbouring countries such as Malaysia & Indonesia.
  • Increased exports and investment into Singapore - in turn bring about rise in national income, promotes economic growth and higher living standards (via multiplier effect); provide more job opportunities; transfer of technology.
  • Foster closer economic integration and increased mobility of factors across countries: e.g. greater capital flows (including funds for development) and increased talent flow, thus expanding productive capacity of country.
  • In response to extremely keen competition posed by the expansion of low-cost manufacturers in China and India - ensuring exports remain competitive through technological advancement and keeping cost of production down.
  • FTAs provide impetus for economic restructuring in the economy if necessary.
  • In response to failure of WTO talks - seek to establish regional and bilateral ties instead.

b. With reference to the given information, comment on the key benefits that Singapore enjoyed as a result of the agreement. [9]

  • 'Comment on': Implies evaluation, making some form of judgment
  • 'Benefits to Economy': On Producers, Consumers and Society as a whole
  • Local firms enjoy cost savings from elimination of tariffs and improved market access to the NZ market. Cost savings also derived from customs cooperation measures and removal of onerous regulations, as well as from cheaper imports, allowing exports to be more competitive.
  • Evidence: Value of total trade has increased. Trade moved considerably in Singapore's favour. Trade balance with NZ chalked up a surplus that grew by 12.6%. Exports from Singapore rose 43% while Singapore bought 17% less from NZ.
  • Producers and service suppliers enjoy national (i.e. preferential) treatment, e.g. in government procurement tenders.
  • Investments into Singapore from NZ rose 106%, bringing about increased NY and employment in the Singapore economy (via the multiplier effect).
  • As more NZ service suppliers set up operations here, consumers also enjoy greater choice of services ranging from retail banking to education. Service standards expected to improve with foreign competition, and prevent monopoly by local firms in Singapore.
  • Increased talent flows and joint research projects also bring about potential benefits to Singapore's knowledge and technological base and can increase our productive capacity, hence promoting economic growth.
  • However, locals may find themselves competing with foreign talents for jobs. Structural unemployment can also occur as Singapore service sectors may need to restructure themselves in a bid to stay competitive in a more open domestic market after the signing of the FTA.
  • We are also not provided details on Singapore's trade volume with NZ relative to Singapore's total trade volume - impact of benefits may not be significant.

c. Using the data provided, critically examine the view that the FTA afforded little benefit for New Zealand. [10]

  • In the short run, NZ does experience a worsening trade position with Singapore;
    Singapore's imports from NZ tend to be on primary products that are inelastic in demand, compared to Singapore exports to NZ which are mainly manufactured goods which are more price elastic in demand. Hence, a reduction in tariffs to both countries will tend to benefit Singapore more in the form of lower import expenditure, but may lead to rising expenditures for NZ as they import more Singapore goods.
  • However, whether allowing free trade in services could reduce or worsen the current account deficit is uncertain, as NZ has certain comparative advantages in the services sectors.
  • NZ also experiences falling net investment inflow against Singapore, which means Singapore gains more from investment inflows into Singapore, that lead to higher income and higher levels of employment.
  • Talent flows between countries may bring about accelerated brain drain from NZ, as NZ workers may decide to work in Singapore to earn potentially higher wages (as evident from the significant disparity in GDP per capita between the two countries).
  • Distort development of secondary and tertiary education services in NZ.
  • Declining share of trade as a proportion of GDP.
  • However ('Critically examine'), other things to consider include:
  • Adjustments in both countries may take a longer period than 2 years.
  • Trade may alter when current contracts expire - or may take time for tastes to adjust to new, cheaper products or for information to circulate.
  • Data concentrates on visible and invisible trade - more data needed to judge this.
  • The change in trade position may have been the result of factors other than the FTA: exchange rates may have changed; terms of trade may have moved unfavourably for NZ (especially since NZ's main exports are agricultural goods/primary products which experience falling prices over time and are inelastic in demand; compared to Singapore's exports which are mainly manufactured, higher valued goods which are elastic in demand) or global economic conditions e.g. recession may have greater implications for NZ.
  • Other benefits for NZ may be less obvious:
    o Greater exposure in Singapore might promote trade, tourism or capital flows which may help NZ in the longer term.
    o Formation of FTA may be an early step and learning experience for more trade liberalisation with other countries to help reduce NZ's relative trade isolation.

Saturday, August 26, 2006

Since 2001, the United States has adopted a tougher policy of trade protectionism towards China.

Yet, China's trade surplus with US hit US$101 billion in 2005, tripling the 2004 figure.

(a) Explain the factors that could lead to a narrowing of China's trade surplus with US. (10)

Introduction

A balance of trade (BOT) surplus occurs when the value of exports of goods exceeds the value of imports of goods. As such, the receipt from exports of goods to the US is greater than payments for imports of goods from US.

Notwithstanding the current trend, China's trade surplus could narrow in the future. This can happen if there is a fall in value of exports to US and/or rise in value of imports from the US.

FALL IN VALUE OF CHINA'S EXPORTS

Poor Performance of US & World Economy

Firstly, the growth of China's export depends on the growth in the export markets i.e. the US and world economy. If global growth continues to be robust, export growth from China would likely to continue.

However, if the US and world economy slows down, China's export growth will consequently decelerate. In view of surging energy prices, rising political instability in the Middle East and the impending Avian Flu pandemic, US economic growth could slow down in the near future which results in the fall in demand for exports from China. Naturally, this would narrow the trade surplus of China.

Revaluation of Yuan

Secondly, government intervention in the form of revaluation could cause the trade surplus of China to fall. America's worsening trade deficit is often attributed to the undervaluation of the RMB and there is increased pressure for the RMB to be revalued.

An undervalued Chinese RMB could lead to widening of China's trade surplus with US. An undervalued RMB makes China's exports into US cheaper and China's imports from US more expensive. It results in fewer US goods being sold in China and more Chinese goods being sold in the US. This results in a BOT surplus for China.

A revaluation of RMB would narrow China's trade surplus by making China's exports to US more expensive (thus reducing the expenditure on China's exports assuming that the demand is elastic) and making China's imports from US cheaper (thus increasing the spending on imports if the demand is elastic).

In July 2005, the RMB was revalued by 2.1 percent against the dollar. At the same time, Beijing began pegging the RMB's value to a basket of currencies that includes the dollar, euro and yen, among others. In view of probable further revaluations and the greater reliance on market forces to determine the external value of RMB, a reduction of China's trade surplus with US is most likely. The situation would be exacerbated if the US dollar depreciates at the same time.

Change in Global Outsourcing Trend (Decreased FDI = Decreased X)

Thirdly, a change in the global outsourcing trend would in turn affect China's export. In 2003, about half of all goods exported from China are from foreign-owned multinational companies or joint ventures.

That share has been growing about 1 or 2 percentage points annually in recent years but may be currently stabilizing or even falling. An indication of this is that foreign capital coming into China in 2005 has reduced slightly - the first time in many years that it will have fallen. That may mean the share of foreign-produced goods would not grow as fast as it has in the past.

This development could be attributed to increased competition for capital investments from other rising economies, like India and Vietnam. On the other hand, resource constraint is also causing rising costs of production in certain regions in China (reducing its comparative advantage in producing certain goods) which could have caused the outsourcing trend to be reversed in China. Consequently, there would be reduced exports to US and the rest of the world. This would narrow the trade surplus of China.

Government Measures

The Chinese government actions taken to tackle the other economic problems facing the Chinese economy (i.e. an excessively fast pace of growth in investment, excess liquidity, and severe hikes in prices for raw materials) may also impact the trade balance. For instance, one of the top priorities for the Chinese government in recent years is to slow economic growth and curb unprofitable investment.

In 2005, the People's Bank of China raised key interest rates and increased the amount banks are required to hold in reserve (i.e. the cash reserve ratio). By doing so, the interest-sensitive components of the AD are likely to fall and via the multiplier effect, the national income is likely to be reduced. Though the reduction in national income could reduce import expenditure from the US (and hence increase the trade surplus), the effect might not be great as the import volume from US is still relatively small. On the other hand, with the increased interest rates, the export production by domestic firms can be hampered due to increased cost of financing domestic export industries. As a result, China’s trade surplus could be reduced.

INCREASED US EXPORTS TO CHINA

On the other hand, the Chinese trade surplus situation could also be affected by an increase in volume of imports from US.

Rising purchasing power of Chinese (­rise in NY = rise in M)

With the rapid development of the Chinese economy at an annual growth averaging 9-10%, the purchasing power of consumers will inevitably increase which lead to an increase in imports.

To gauge the rising purchasing power of Chinese consumers, the automobile sector is the best example - about 95% of the automobiles sold there are made by foreign companies or joint ventures. If this trend of increased consumption continues, there could be a rise in the demand for US goods, especially consumer products in the near future. This would lead to a narrowing of the China’s trade surplus with US.

Reduction of trade barriers in China & Improved US productivity

Other factors that could lead to a rise in US exports to China could be reduction of trade barriers by China after joining the WTO and improved productivity in the US which is translated to better quality and price competitive products to be exported. However, these might require time to materialize as it takes economic restructuring. This is further hampered by the current protectionist postures taken by the US.

Conclusion

In conclusion, there are various factors that could cause the trade imbalance between China and US to narrow.

The decrease in the value of export from China is likely to occur given the influences of reversed outsourcing trend, bleak outlook of the US and world economy and probable revaluations of the RMB. In addition, the narrowing of trade surplus could take place due to future growth of Chinese demand for US consumer goods.

(b) Comment on the likely effects of a 'tougher policy of trade protectionism' adopted by US on the economies of US and China. (15)

Introduction

Despite the apparent benefits of free trade as encapsulated in the theory of Comparative Advantage, US still took measures to protect their own industries from foreign competition in 2001. Ironically, 2001 was the year China joined WTO when it sought to integrate into the world trade system.

The US government perceived that trade protection could help to deal with a rising competitor and enhance its citizens' welfare. Moreover, there is the possibility of some limited gains such as increased domestic production and employment and reduction in the balance of payment deficit for the US. However, many of these gains could be temporary and self-defeating in nature. In the long run, countries tend to lose from protectionism, as predicted by the Theory of Comparative Advantage.

Effect: Domestic Production & Employment

US
An apparent advantage of increased trade barriers by US is that domestic industries within US would be shielded from competition by the Chinese producers which could produce cheaper goods. With reduced imports from China, domestic producers will now fulfill the demands of the massive American market. Consequently, the output for the domestic industries will increase and new jobs in US, which in turn could improve the standrad living in US. This could lead to positive spillover effects into other supporting sectors, like transportations and marketing.

However, there are extensive statistics to indicate that protectionism could hurt the very country which impose it. For example, it is estimated that between 45,000-75,000 jobs were lost as a result of the steel tariffs imposed by the Bush administration between March 2002 and December 2003. The tariffs caused higher steel prices which in turn made US companies which depended on steel less competitive in the world market.

China
Due to the increased protectionism by US, Chinese exporters will have reduced access to the massive US market on a competitive basis, thus reducing its ability to export and to attract foreign investments. This could lead to fall in production and employment, resulting in slowdown in economic growth.

In the longer-term, this might ultimately lead to the establishment of alternative markets for its exports and further development of its own domestic markets. Incidentally, the Chinese government has been actively promoting in recent years to reduce its reliance on export sector to drive economic growth.

Effect: Balance-of-payments

US
One of the key impetuses of increased protectionism by US is to reduce the trade and BOP deficit. The US government resort to protectionism to reduce the value of Chinese imports. This may reap short-term benefit for the US if the Chinese imports are curtailed. However, China accounts for less than 10% of all US imports, and Chinese imports are far less than 2% of US GDP. Thus, the effects of increased protectionism maybe over exaggerated.

Moreover, this policy to correct balance of payments deficit is an interim measure as protectionism does not remove the fundamental cause of the US's trade deficit which is due to a lack of competitiveness in areas such as pricing, quality, reliability, delivery, design, ineffective marketing etc. Thus, US should instead revise and restructure its economy so as to improve international competitiveness. Thus, in longer-term, the increased protectionism does not resolve the trade deficit problem for US.

China
For China's case, its trade surplus with US could be narrowed due to increased US protectionism. Foreign companies in a variety of industries might relocate its businesses away from China, reversing the outsourcing trend. In the longer-term, increased trade protectionism faced by China might compel China to seek alternative export markets and forge new trade partnerships with other emerging economies, like Russia.

Also, as with other newly industrialised Asian economies, China may seek to restructure its economy into an increasingly more knowledge-based one by diverting its resources from labour-intensive into capital-intensive, high-tech manufacturing and services industries. In the process of restructuring, they will have to bear some dislocation costs, for example rising structural unemployment.

Effects: Inflation Rates & Cost of Production

The protectionist stance by US could have an impact on its price stability. The American consumers including business consumers in the manufacturing sector - are among the beneficiaries of cheap Chinese imports. The cheap Chinese imports have helped many US industries maintain their competitiveness and expand global market share in a way that would not be possible if they were restricted only to US-based production. Chinese production is now well-integrated into the global value-chains of US manufacturers.

Thus, protectionism against China could contribute to a reversal of the low inflation that US consumers have been enjoying for years, which has kept interest rates low even as the US economy recovers from recession. Also, it results in the loss of consumer welfare caused by higher prices and possibly reduced consumer choice.

Conclusion

Although there are some short-term positive effects that make protectionism seems attractive to the US, the costs for protectionism can be high in the longer-term and if viewed from a wider context. Countries practising protectionism usually experience welfare loss in the form of reduced consumer surplus, choices and higher prices and reduced export earnings as protectionism reduced the income and capacity to import by other countries. Protectionism also causes misallocation of resources.

As an alternative to protectionism, US should instead try to stimulate its export competitiveness by making efforts to improve the productivity and lower unit cost of production of domestic industries by having better training and education etc.

Friday, August 18, 2006

Foreign Trade Patterns - A Matter of Demand & Supply


Trade in goods and services was Singapore's life blood as truly in 1989 as it was in the early twentieth century or a century earlier when the British East India Company first began business there. Trade, along with domestic savings and foreign investment, remained key to the country's growth. Singapore traditionally had a merchandise-trade balance deficit (in part at least because food was imported), which it customarily offset with a surplus on the services account (see table 8, Appendix). It was one of the world's few countries where total international trade (domestic exports and reexports plus imports) was greater than total GDP. In 1988 trade (S$167.3 billion) was more than three times GDP (S$48 billion), and two-thirds of the goods and services Singapore produced were exported.

Singapore, however, was more than simply a trade and manufacturing center in the late 1980s. Trade and manufacturing were closely tied to the country's expanding business services and international financial market; each enhanced the other. In addition to the more than 650 multinational companies that had set up manufacturing plants and technical support facilities, several thousand international financial institutions, service companies, and trading firms also maintained a presence in Singapore. The increasing internationalization of the economy and the continuing centrality of external trade meant that world trade fluctuations and the state of the global economy were significant factors-- largely out of the country's direct control--in what happened to Singapore's trade and wider economy.

As a British colony in the nineteenth and early twentieth centuries, Singapore was an entrepôt for the exchange of raw materials from Southeast Asia--mainly present-day Indonesia and Malaysia--for European merchandise. Newly independent Singapore's decision in 1965 to emphasize industrial development and the growing success of that plan gradually resulted in a significant change in the nature of trade. By the mid-1970s, the proportion of reexports and domestic exports had been roughly reversed, with reexports accounting for less than 41 percent.

In the 1980s, the somewhat diminished entrepôt trade remained important, and Singapore continued to act as a regional processing and distribution center. Reexports' share of total exports averaged 35 percent from 1980 to 1987. Although primary commodities (crude rubber, nonferrous metals, and to a lesser extent palm and coconut oil) were still a factor in trading activities, machinery and transportation equipment dominated. Singapore also served as a back door to trade with Asian communist countries for third countries, such as Indonesia.

Between 1980 and 1984, total exports grew an average of 5.5 percent per year. The strongest impetus came from the newer electrical and electronics industries. The trade deficit declined steadily after 1982, reflecting lower commodity prices paid to foreign producers, greater levels of internal efficiency, and industrial upgrading. In 1985, however, total exports decreased by 2.26 percent. Higher value-added exports declined, both as a function of weaker demand and a worldwide saturation in many areas, such as computer peripherals. Petroleum exports, still a major sector, virtually stagnated.

Trade, along with the rest of the economy, reasserted itself by 1987, resulting partly from government economic decisions and partly as a reflection of rising world commodity prices. In 1988 Singapore's total trade amounted to about S$167.3 billion (US$80.8 billion), with a global trade deficit of about S$8.18 billion. Singapore's GDP grew by 10.8 percent in 1988, the best growth rate in fifteen years. Disk drives were the largest non-oil item exported, worth S$4.89 billion. Other major exports were integrated circuits, data processing equipment and parts, telecommunications equipment, radio receivers, clothing, and plastics.

By early 1989, signs of slowing down and leveling off had appeared with the first export declines in eighteen months. Analysts agreed the weak external demand for electronics and computer parts resulted, in part, from an oversupply on the world market of disk drives, semiconductors, and related items. Imports surged, however, widening the trade deficit sharply.

Although their volume was not large, food products were a significant aspect of Singapore's trade. The urban nation produced only a small proportion of its own food (see Agriculture , this ch.), requiring it to import large quantities. Some food products, such as soy sauce and juices, were processed in Singapore for export, and Singapore continued its historical role as the regional center for the spice trade.

Data as of December 1989

Thursday, August 17, 2006

2005 Stella Awards

Time once again to review the winners of the Annual "Stella Awards." The Stella Awards are named after 81 year-old Stella Liebeck who spilled hot coffee on herself and successfully sued McDonald's (in USA). That case inspired the Stella Awards for the most frivolous, ridiculous, successful lawsuits in the United States. Here are this year's winners (from 5th to 1st place)

5th Place (tie): Kathleen Robertson of Austin, Texas, was awarded $80,000 by a jury of her peers after breaking her ankle tripping over a toddler who was running inside a furniture store. The owners of the store were understandably surprised at the verdict, considering the misbehaving little toddler was Ms. Robertson's son.

5th Place (tie): 19-year-old Carl Truman of Los Angeles won $74,000 and medical expenses when his neighbour ran over his hand with a Honda Accord. Mr. Truman apparently didn't notice there was someone at the wheel of the car when he was trying to steal his neighbour's hubcaps.

5th Place (tie): Terrence Dickson of Bristol, Pennsylvania, was leaving a house he had just finished robbing by way of the garage. He was not able to get the garage door to go up since the automatic door opener was malfunctioning. He couldn't re-enter the house because the door connecting the house and garage locked when he pulled it shut. The family was on vacation, and Mr. Dickson found himself locked in the garage for eight days. He subsisted on a case of Pepsi he found, and a large bag of dry dog food. He sued the homeowner's insurance claiming the situation caused him
undue mental anguish. The jury agreed, to the tune of $500,000. In my opinion this is so outrageous that it should have been 2nd Place!

4th Place: Jerry Williams of Little Rock, Arkansas, was awarded $14,500 and medical expenses after being bitten on the buttocks by his next door neighbour's beagle. The beagle was on a chain in its owner's fenced yard. The award was less than sought because the jury felt the dog might have been just a little provoked at the time by Mr. Williams who had climbed over the fence into the yard and was shooting it repeatedly with a pellet gun.

3rd Place: A Philadelphia restaurant was ordered to pay Amber Carson of Lancaster, Pennsylvania, $113,500. after she slipped on a soft drink and broke her coccyx (tailbone). The beverage was on the floor because Ms. Carson had thrown it at her boyfriend 30 seconds earlier during an argument.

2nd Place: Kara Walton of Claymont, Delaware, successfully sued the owner of a night club in a neighbouring city when she fell from the bathroom window to the floor and knocked out her two front teeth. This occurred while Ms. Walton was trying to sneak through the window in the ladies room to avoid paying the $3.50 cover charge .. She was awarded $12,000 and dental expenses.

1st Place: This year's runaway winner was Mrs. Merv Grazinski of Oklahoma City, Oklahoma. Mrs. Grazinski purchased a brand new 32-foot Winnebago (RV) motor home. On her first trip home, having driven onto the freeway, she set the cruise control at 70 mph and calmly left the driver's seat to go into the back & make herself a sandwich. Not surprisingly, the RV left the freeway, crashed and overturned. Mrs Grazinski sued Winnebago for not advising her in the owner's manual that she couldn't actually do this. The jury awarded her $1,750,000 plus a new motor home. The company actually changed their manuals on the basis of this suit, just in case there were any other complete morons around.

The Malaysian government may change the ringgit's peg to the US dollar

if the value of the greenback continues to slide against the euro and yen, a top official said…. The ringgit has been pegged at 3.80 to the US dollar since September 1998. ……….Some analysts believe the time has come to end - or at least change- the peg.

Source: The Straits times, 23rd March 2004

Evaluate the merits of pegging the exchange rate and consider what should be the appropriate level of the exchange rate [25]

Exchange rate controls have always been controversial as they are seen as governments intervening with market forces of supply and demand of domestic currency. So too has Malaysia's currency peg and capital controls been questioned. In argument, there are various pros and cons to pegging the exchange rate to consider.

[Insert demand/supply diagram here, similar to Fig. 15.2, p432 of Sloman, 5th ed.]

Pegging the exchange rate implies setting a price for domestic currency higher or lower than the equilibrium level as determined by market forces (at Pe and Qe). This means the central bank will have to buy up the surplus domestic currency if the peg is too high or sell more if the peg is too low to maintain the pegged price above or below equilibrium.

There are various advantages to the fixed exchange rate regime.

The most fundamental of all is stability. Foreign investors are more confident in investing in your country, knowing that they can plan their finances without the uncertainty of exchange rate fluctuations when they repatriate profits or sell operations and exit the country.

By fixing the currency's value below the equilibrium level, as is the case with Malaysia, exports become more competitive as they now cost less to foreigners and domestic aggregate demand is boosted as consumers switch from now more expensive imports to locally produced goods. If the Marshall-Lerner condition holds, and supply is price elastic enough, the balance of trade (BOT) (and perhaps the balance of payments (BOP) account) will improve. If the peg is a dirty float or adjusted regularly, then the government can tweak the economy in a way which suits its policy objectives through fixing exchange rates. Inflation due to exchange rate fluctuations is also reduced.

Another major reason for Malaysia to fix its exchange rate was to deter speculation. In the wake of the Asian financial crisis, speculators made huge profits by running on the central banks of many South-East Asian countries, causing economies once booming to collapse overnight. By pegging the currency, there is no speculation which can destabilise the economy.

However, there are many disadvantages to take into consideration. There is the problem of imported inflation where inflation in another country spreads to the domestic economy via the fixed exchange rate. BOP imbalances which were once automatically balanced by the floating exchange rate will become a concern for the government.

There is also a policy control loss over monetary policy, as the Malaysian central bank will no longer be able to control interest rates, although this may not be the case because in Malaysia's case, capital control laws were also implemented.

In fiscal policy, the concern will be over the dampening effect of the change in money supply, which will cause capital flows, thus distorting the original aim of fiscal policy. The central bank, in pegging the currency must also keep foreign reserves, which could have been spent more productively elsewhere.

Having said that, back in 1998, there was some merit in Malaysia's decision to peg its currency. The Asian financial crisis hit it badly and speculation was a big concern to the government. This path to recovery was chosen and the peg was instituted. At that time, it looked like a necessary evil.

However, its relevance today is questionable. Gone are the days of George Soros and Malaysia's economy has largely recovered. Today's exchange rate is much below the equilibrium level and needs to be reconsidered by the central bank. It can be cautious and adopt a dirty float instead of a full fledge flaot, and still maintain a sizable control over the Ringgit's value. But the peg cannot go on forever.

Saturday, August 12, 2006

Explain why governments are sometimes concerned with the level of national income in their countries

and discuss the usefulness of these data in assessing the level of people’s welfare.

As a theoretical concept, the level of national income is defined as a net national product at factor cost, i.e. the total value of goods and services produced by a country’s residents, net of capital consumption, taken at the value of returns to factors of production. Governments, faced with the practical difficulties of measuring such an entity, take to using gross domestic product (GDP) or gross national product (GNP), i.e. not factoring capital consumption, in their monitoring of national income.

Governments see a need to obtain such measurements and monitor the progress of these statistics primarily to chart the economic progress of the economy they have under their custody. GNP is a measure of the total market value of goods and services produced by a country’s residents within a fixed year of computation. GDP is much the same concept, except that instead of measuring production by factors owned by a country’s residents, it measures the production taken place by harnessing a country’s resources within its own boundaries. In this way, GNP and GDP serve as good indicators of the economic performance of countries. Governments, for political and economic considerations alike, have an interest in ensuring healthy economic progress and growth whether as a proof of correct policy decisions or as a warning of possible economic trends. If developments in national income are unfavourable, governments can adjust policy mechanisms to restore growth or health in the economy.

Another possible source of attention as towards government monitoring of national income statistics stem from the concept that national income statistics provide a reliable proxy indicator of the standard of living in a country and the material wellbeing of a population, by nature of its definition and components, and the concept of the circular flow of income. The accuracy of this figure as a proxy can be improved by obtaining an average measure of welfare for a person in the population, taking a per capita measure of national income. The data can also be corrected for inflation and purchasing power parity, although the latter is not crucial for self-examination.

However, it is imperative to note that while national income data per capita are reliable proxies for the standard of living and welfare, they are by no means complete measures of wellbeing, for they miss out non-material aspects of welfare, and face all the problems associated with average figures.

National income statistics may exclude certain sources of material satisfaction in an economy. This may not be due only to difficulties in data-collection, but may also be due to that fact that economies have an array of non-marketed goods – subsistence production, illegal and underground trading activities, gambling and drug-trafficking in some countries. These figures may add substantially to material welfare, depending on the unique circumstances of different economies, and their exclusion reduces the credibility of national income figures, especially for developing economies.

A major limitation of national income in estimating the welfare of a population is its inherent economic characteristic, and hence its inability in including non-material aspects of welfare. Typically health and education standards are cited most frequently as notable omissions in national income statistics. While it is understandable that these are measurement-resistant variables, their quality is important in determining the welfare of a population, and some form of analysis on standards of literacy, health, longevity, infant mortality, law and order, social ills, political freedom etc. are important complements to national income in assessing welfare.

Even if all these were taken into account, per capita measures cannot escape the major weaknesses of average figures. Data fails to take into account demographic diversities in the population. Per capita figures conceal possible differences in income distribution. Glaring income differentials are not a source of pride for any country or government, but national income figures fail to bring up the problem and hence preclude their absolute usefulness in indicating welfare of people.

The usefulness of national income figures is derived from the direction of the numerical movements in the figures. More often than not an increase in national income may correlate with an increase in welfare, although problems with averages may persist.

Nonetheless, it can be observed that not only governments, but the world community at large sees merit in using national income figures as a best measure of material wellbeing and the best indicator available of actual welfare. The efforts of the United Nations at formulating the Human Development Indices for countries testify to the concern with welfare, and the indices include the use of national income figures. While in keeping with the advice of economist John Kenneth Galbraith, “we should use it for what it tells us, as long as we know what it doesn’t tell us”, keeping in tandem with the changes in the direction of income statistics and their values, one has a best chance of getting a good picture of the actual level of welfare.

The price of crude oil is hovering around record-breaking peaks after unrest in Iraq halted production.

Companies are feeling the effect of higher fuel and raw material costs, while there are worries that consumers may spend less. Fears about consequences of any further supply disruption have risen and governments are keeping a close watch on future development.

a. Explain why the price of fuel has been rising rapidly. [10]


The oil price has been rising in the recent months, arriving at the highest level in the history. This rapid rise in the price of fuel is unavoidable given the demand and supply conditions of the oil.

The price of fuel is largely determined by the forces of demand and supply of oil.

From the demand side, there are a few reasons for the increase in demand. Firstly, the world population is growing, the world demand for all kinds of products including cars, TVs and so on increases. And oil is the primary product that is necessary for the production of these manufacturing goods. Thus, increase demand of these commodities has resulted in the increase demand of oil.

Secondly, in recent years, many countries are so keen in developing their economy. Rapid economic development and industrialisation, especially in China, has caused a huge increase in demand for oil which is essential for economic development. Its importance to the economic development is similar to the importance of water to the survival of human beings.

Thirdly, the increase in oil consumption is also resulted from the increase usage of private cars. Due to economic development leading to rising affluence, many people who were previous not able to afford cars are buying cars in countries like China. Moreover, increasing usage of airplanes for long distance travel also resulted in an increase in the oil demand.

(Another demand-side factor to consider: Expectations of future price of fuel)

From the supply side, there may be an increase in supply due to better technologies and output increase order by the OPEC. More importantly, since oil is a primary product, its supply is limited and it is relatively price inelastic in supply. Production of oil is not able to respond to price changes or demand changes rapidly. Since the production of fuel is at its maximum, the supply of oil only increases marginally while the demand has increased greatly. As such, the supply relative to demand is actually decreasing and price of oil, thus, increases. This can be seen from Diagram 1.

As mentioned in the preamble, the production of oil has been seriously affected by the Iraq War. When supply of fuel falls and demand for it increases, price of fuel will increase (Diagram 2).

(However, in reality the war in Iraq has not affected the current supply of fuel much. This is because prior to the war, there has already been an embargo imposed on Iraq's exports, including fuel.)

In conclusion, the huge increase in the demand for oil and the relatively small increase in supply or even decrease in supply together with the inelastic nature of oil supply have resulted in the rapid rise in the fuel price.

b. Discuss why it is necessary to keep a close watch on the future development of oil prices. [15]

According to the preamble, "governments are keeping a close watch on future development of oil prices." This may be necessary for governments as well as individuals because oil price affects the economy to the extent that its impact cannot be neglected.

To the individuals, oil price will affect many individuals' decision making. To a company owner, an increase in the oil price will mean the cost of production is increasing because nearly all kinds of production require oil as raw material. Just take an example of airlines. Jet fuel consists of a great proportion of an airline's variable cost. As a raw material, oil is essential. The rise in its price will result in higher costs. Since traditionally firms are assumed to be profit maximising and profit= total revenue- total cost. When the cost increases, profit will be affected. This will then affect the decision making of a firm when deciding what level of output is to be produced. If the price of oil rises to the extent that its revenue will no longer cover its variable cost, including the cost for oil, a producer may want to leave the industry.

Besides, company worries that an increase in its cost will drive up the price of the commodities which results in the consumers to spend less (reduction in TR). However, this is only necessary if the demand for the commodity is price elastic. Price elasticity of demand (PED) is the responsiveness of quantity demanded of a good with respect to the change in price, ceteris paribus. If the PED is elastic, producer will incur a loss when the price of the good increases due to the increase price of oil because consumers will spend less. Total revenue will reduce from P1BQ1O to P2AQ2O as shown in Diagram 3.

However, if the PED is inelastic, producers will be able to pass on the increase of production cost to the consumers and continue to enjoy high revenue. Moreover, the extent of usage of oil as a production material also needs to be considered. If the usage of oil in industry A is less than that in B which is producing substitute of A. Then, the increase in oil price will not be a worry to industry A because consumers will switch to A as a substitute of B. Thus, whether a company needs to keep a close watch on future oil price depends.

(Other parties: Users of cars - transport industry - travel industry, public transport)

However, for the government, it is important to do so for long run sustainable development of a country. Oil is a primary product. The fluctuation of its price will have effect on all kinds of industries (increased uncertainty leads to reduced investment). Thus, its fluctuation may result in economic fluctuation as a whole, resulting in unstable general price level. As such, inflation due to supply side shock may result. Since stable and mild inflation is important to a healthy economy, price of fuel which destabilizes the GPL needs to be watched.

Further more, price of oil also affects the ability of an economy to further develop. For the oil producing country, since oil is non-renewable, its depletion reflected by increasing price levels is an indication of the danger of unsustainable economic development. Thus, governments in oil producing countries may need certain measures to conserve oil and develop alternative energies. For the non-oil producing countries (oil importing countries), they too need to develop alternative energies (substitute to fuel) to ensure their own long term economic development and survival. In addition, they need to formulate policies to keep out imported inflation arising from rapid rise in oil prices.

Nonetheless, allowing the price of oil to increase rapidly to reflect its growing scarcity may not necessarily be a bad thing. Rising prices of oil tend to encourage users to be more conservative in their use of oil. Some countries try to dampen the increase in the price of oil by practicing price controls or by providing subsidies. However, in doing so, they distort the efficient allocation of resources and encourage excessive use of oil which in turn results in wastage. Conserving the environment is part of sustainable growth.

In conclusion, for a company, whether it is necessary to keep a close watch on the oil price depends due to the different elasticity of demand for the commodities. But for governments, it is important and necessary to do so because oil is an important primary product that the development of an economy will have to depend on.

Wednesday, August 09, 2006

A monopolistically competitive market is vastly different from a monopoly.

a. Explain the above statement. [10]
Monopolistically competitive market (MPC) and monopoly are both different forms of market structure. Market Structure is the characteristic of an industry that affects the firm's behaviour and its level of performance. Both MPC and monopoly are price searching. Example of MPC is hairdressing industry while that of monopoly is the utilities industry.

The MPC is vastly different from the monopoly. In the MPC, there are a large number of sellers compared to only 1 seller in the monopoly. There is hence competition between firms in an MPC but no competition for a monopoly. The goods produced by the MPC are close substitutes for each other but the goods are slightly differentiated. In a monopoly, there are no close substitutes.

In the MPC, there are no barriers to entry. New firms can enter or leave the industry without incurring any cost. However, in the monopoly, there are barriers to entry. These can take the form of natural barriers. The firm could be a natural monopoly, facing a constant downward sloping LRAC. This industry has only space for 1 firm, hence new firms cannot enter. Moreover, new firms may have to incur high start up costs to enter the industry. The necessary technology may be unknown to new firms as well. A monopoly may also hold a patent or a certain copyright which prevent other firms from entering.

In the long run, a MPC firm is unable to make supernormal profits. Supernormal profits is total revenue greater than total cost (which includes opportunity cost). This is because MPC firms face no barriers to entry. If there are supernormal profits to be made, new firms will continue to enter the industry. In the long run, MPC firms can only make normal profits where total revenue = total cost. For a monopoly, it is able to make supernormal profits as long as it can maintain its barriers to entry and prevent new firms from stealing part of its profit pie.

The demand curve of the MPC is downward sloping and is more price elastic than that of the monopoly since there are so many substitutes available. The MPC firm has no industry demand curve since each firm has independent pricing policies and hence charge different prices. The monopoly industry demand curve is the firm's demand curve, since the monopoly is the only firm in the industry.

In MPC markets, there will be a lot of resources spent on advertising. Since products are differentiated and there is intense competition, producers advertise to increase demand. In the monopoly, there is no need to advertise since it is the sole seller of the product.

Given that the MPC demand curve is downward sloping and it makes normal profit, MPC firms will operate with excess capacity. This is different from monopolies, which may over-utilise or under-utilise a plant.

b. Discuss what advantages and disadvantages might occur when the market becomes more monopolistic in nature. [15]

When a market becomes more monopolistic, it moves from a monopolistically competitive market to a monopoly.

When a market becomes more monopolistic, the firms in the market are now able to enjoy economies of scale. As output increases, the cost per unit of output drops. This can be seen in the falling arm of the LRAC below. The most optimum output is when Q = Q*. This is at the minimum efficient scale, which occurs at a high output level. Only a monopoly producing a large output can reap this benefit, a small producer in the MPC cannot.

Photobucket - Video and Image Hosting

Moreover, a firm in a monopoly can make supernormal profit. These profits can be channeled back into research and development, maintaining barriers to entry, but at the same time lowering cost of production resulting in greater efficiency.

Moreover, monopolies might result in innovation, according to Schumpeter's "creative destruction". The incentive to reap supernormal profits will cause new firms to think of innovations to destroy a monopoly. This can be seen when the introduction of faxes resulted in the breakdown of the post office monopoly.

A monopoly also avoids wasteful competition. Resources are not wasted on advertising, which could have been otherwise used more efficiently. For example if a TV channel has 2 options and 90% of the people want to watch a World Cup final and 10% want to watch an opera. If there are 2 stations owning 2 channels, both will show the World Cup final and there will be welfare loss. However, if there is a monopoly, it will show both the World Cup final and the opera on the 2 channels, hence avoiding wasteful competition.

Moreover, the monopoly can produce at a productively efficient manner by chance.

Photobucket - Video and Image Hosting

As shown above, the monopoly can produce at Q, which is the lowest point of the LRAC and is hence efficient.

A monopoly can also practice price discrimination because it has monopoly power. In first degree price discrimination, allocative efficiency is achieved as P = MC.

There is no welfare loss to society. Consumer surplus just becomes producer surplus. Moreover, goods that previously could not have been produced can be produced under price discrimination. However, when a market becomes more monopolistic, it has its disadvantages. It might result in x-inefficiency, which is organisational slack due to a lack of competition. Monopoly will have no incentive to lower costs since there is no competition and they are already earning supernormal profits.
Photobucket - Video and Image Hosting

Moreover, the monopoly will charge a higher price with a lower output as its demand curve is higher and relatively more inelastic. It will then have a larger welfare loss compared to the more elastic demand curve of the MPC.
Photobucket - Video and Image Hosting
Pm is clearly higher than Pmpc. Although Qmpc < Qm, there are many MPC firms in the industry but the diagram only shows demand for 1 firm since there is no market demand for MPC. Hence total output will be greater. Triangle A is greater than triangle B, hence indicating higher welfare loss for monopoly.

The monopoly will also earn supernormal profits given by the shaded area C. This will result in income inequality favouring the factor owners. Moreover, there will be a decrease in variety since the monopoly has no close substitutes.

In conclusion, moving from a monopolistically competitive market to a monopoly has its advantages and disadvantages but I feel that the advantages outweigh the disadvantages especially if the firm is a natural monopoly and there are a lot of economies of scale to reap at higher output.

Monday, August 07, 2006

Sterling heading for $2 barrier (BBC World - Sunday, 6 August 2006)

The pound has jumped in value against most major currencies. The shock rise in UK interest rates last week has sent the pound jumping higher against the dollar and other currencies, a trend that may continue. .

Sterling rose more than two cents to $1.91 on Friday, a 15-month high.

Analysts think the pound could near the two-dollar mark in coming months as investors pile into the currency.

They expect the Bank of England to raise rates even further from their current 4.75%, presenting a good yield for those buying into the pound.

Sterling has also risen against the euro and the yen, helped by the fact that UK interest rates are higher than those in Japan and the European Union.

Bad for exporters

A high value pound has mixed implications for UK businesses and consumers.

We are revising our forecasts up, and do see the possibility of the pound hitting $2 - Simon Derrick, Bank of New York

It makes UK exports more expensive on overseas markets, but it means companies buying raw materials in from abroad can get more for their money.

It also means that some imported items are cheaper in the shops, which is good news for consumers.

This can help keep a lid on the overall level of rising prices, known as inflation.

However a strong pound is bad for the UK trade deficit, which hit a higher than expected £6.8bn ($12.4bn) in May as the country imported much more than it exported.

At the same time as the pound is becoming more attractive to currency traders, the dollar is losing its appeal - partly because the US Federal Reserve is expected to pause its cycle of raising interest rates.

The central bank's federal open market committee (FOMC) meets on Tuesday, to decide on whether to continue its series of 17 consecutive hikes, which have left the country's benchmark interest rate at 5.25%.

Currency traders have been switching their reserves out of the dollar in the belief that the Fed may hold steady, or if it does raise rates again, signal that it will stop there.

Weakening dollar

It is this divergence in monetary policy cycles - rates heading higher in the UK while looking set for a pause in the US - that economists believe will give the pound more upward momentum in the weeks ahead.

"We are revising our forecasts up, and do see the possibility of the pound hitting $2," said Simon Derrick, chief currency strategist at the Bank of New York.


Goods about to be shipped from Shanghai
A high value pound means foreign imports are cheaper

Sterling last reached the $2 mark in September 1992, just before the "Black Wednesday" crisis, when currency speculators forced the UK government to withdraw the pound from the European Exchange Rate Mechanism.

If the pound does pass the $2 mark, currency experts believe it will be a reflection of the dollar's weakness across the globe.

China has gigantic reserves of foreign currency, much of which is held in dollars.

"Since April there has been more and more comment from Chinese central bank officials about the composition of their reserves," said Mr Derrick.

"There is a definite feeling that they are uncomfortable with their weighting of dollars."

If the Chinese central bank starts selling noticeable amounts of its dollar reserves, it would weaken the dollar even more in the eyes of currency markets.

There are signs that other central banks are seeing sterling as a more attractive option, with the Bank of Italy announcing recently that it had slashed its dollar holdings and moved a quarter of its foreign reserves into the pound.

Keynesian Model of Income Determination

(a) Explain what is meant by the equilibrium level of national income [8]

John Maynard Keynes created a revolution in economics in the 1930s when he argued that the economy is in fact led by demand.

In the Keynesian model which he presented, he demonstrated that the equilibrium level of national income is the position to which the economy will tend, and having reached that position it will be under no pressure to shift, ceteris paribus. Generally, if firms sold all output they planned to sell, and there is no unplanned building up or running down of stocks, the economy will be in equilibrium position. This can be analysed via two approaches: the income-expenditure approach, and the saving-investment approach, and the former will be analysed here in greater detail.

The income-expenditure approach can be presented by the following graph:

Photobucket - Video and Image Hosting

At output Y1, there is an excess of expenditure over national income. This means that there is insufficient output to meet the expenditure, and what results is an unplanned inventory disinvestment (running down of stocks). This will send a signal to firms to increase output, causing national income to rise. Such pressure will persist until national income reaches the equilibrium position of NY = YE, where planned savings is equal to planned investment.

At output Y2, expenditure is less than the output produced, and what results is an unplanned inventory investment, or building up of stocks. This then sends a signal to firms to cut down on production, thus national income will fall until it reaches the equilibrium position of YE.

In reality, the economy is rarely in exact equilibrium position; rather, what happens is that the economy is constantly heading towards the equilibrium position, and although it often does not land exactly in that position, the Keynesian Model does explain to us why it continues to move in the direction of the equilibrium.

Analyse the impact on the economy of an increase in (i) income taxes (ii) investment [17]

In order to analyse the impact of a rise in income taxes, we have to first understand the concept of the multiplier and the Marginal Rate of Withdrawals (MRW).

An injection in the economy will cause a bigger increase in national income, and this is often referred to as the multiplier effect. This is because part of the income generated from the injection will be passed on to other sectors of the economy, and this process continues, creating a “snowballing effect” – causing the larger rise in national income. The size of the multiplier hinges crucially on the MRW, which comprises the Marginal Propensity to Save, the Marginal Propensity to Import and the Marginal Rate of Taxation. Generally, the multiplier can be calculated by the formula k = (1/MRW).

Since MRTax forms a component of MRW, an increase in the income tax will cause MRW to rise (ie more ‘leakages’ from the economy), and this can be represented in the following diagram:

Photobucket - Video and Image Hosting

An increase in income taxes will increase the gradient of W, causing it to shift from W1 to W2. Thus, a rise in injection (I1 to I2) will only trigger a smaller multiplier effect (change in Y1 is bigger than change in Y2) due to the fact that more money has ‘leaked out’ from the circular flow of income, and not passed on.

Certainly, the extent of the decrease in the size of the multiplier depends on several factors. The bigger the proportion MRTax is of MRW, the sharper the decrease in the multiplier. At the same time, the above analysis can only work if MPS and MPimp remain constant (assume ceteris paribus).

An increase in income taxes may also impact the economy in other ways. For instance, it may lead to a fall in foreign investment as foreign investors are deterred from coming in due to the high rate of direct taxes. A sharp increase in income taxes may also lead to capital flight, as rich people move out of the country. Both these effects may lead to a fall in consumption and/or investment, and consequently national income further decreases. On the other hand, if the increase in income taxes is used to finance further government spending (eg balanced budget multiplier), then national income will rise by the amount of government spending.

Investment is arguably the most volatile component of national income, and broadly speaking it can be classified into two types: capital investment (spending on capital, eg building of factories, roads, etc) or inventory investment, which has been explained earlier on.

Since investment is a component of national income, an increase in investment will lead to a rise in national income, the extent to which will be determined by the multiplier effect. In the short run, a rise in investment will lead to actual growth, as the economy moves out towards the Production Possibilities Curve. Of course, if the economy is already at full employment level, then an increase in investment will only generate inflationary pressure.

If the increase in investment results in a rise in national income, the accelerator effect may kick in: that is, the rise in national income may trigger a (usually bigger) rise in investment.

In the long run, an increase in investment will boost the supply side, leading to potential growth, or a shift outwards of the Production Possibilities Curve. This means that the economy’s capacity to produce goods and services will increase in the long run.

If the rise in investment is a result of foreign investment, in the short run it may be considered a credit on the Balance of Payments, as foreign firms pump money into the economy (eg to build a factory). In the long run, however, it may be a debit on the BoP as the profit derived from the investment is repatriated abroad.

Ultimately, we have to consider if the increase in investment is for a worthwhile purpose. In Japan, for example, there may have been a rise in investment as the government aggressively invests in construction and road building, but many economists believe that such investments are not worthwhile (eg building of ‘roads to nowhere’) – leading us to suspect that the impact on the supply side is dubious at best.

Thursday, August 03, 2006

People want brightly lit and safe roads. They also want reliable health services and quality education.

Government regulation is the only way to provide them.

To what extent do you agree with the above statement? [25]


In modern economics, goods and services are normally provided by the free market. However certain goods and services are provided by the government, for different reasons.

Public goods are by nature non-diminishable and non-excludable. They are non-excludable as once they are provided for, it is very difficult to prevent others who have not paid for them from enjoying the benefits they offer. For example, when “save roads” are provided, how can it be safe only for those who have paid for it and unsafe for those who have not? This gives rise to the free-rider problem, wherein consumers choose not to divulge their demand for the good, hoping instead that others perhaps less intelligent or more desperate for the good will pay for it. Without market demand, market forces cannot act to determine a price for the good, hence firms will not provide it.

In addition, public goods are also non-diminishable. The consumption of the light from a streetlamp will no decrease the amount of light available for the next person. Thus marginal cost, which is defined as the cost of producing an extra unit of output, is effectively zero (MC=0).
Firms determine their equilibrium price and output by the point where MC=MR, MR being the additional revenue the firm earns by producing an extra unit of output (marginal revenue). If MC=0, then the equilibrium price they should charge should be equal to zero and the good should be provided for free. It is hence unlikely that private firms would be willing to supply a good that will provide no returns.

Provision by the government is most feasible then as the government can provide the good and charge it via compulsory taxes paid by the citizens of the country. This way, public goods are provided for and payment is received.

There are however problems with government provision of public goods. A major problem is the difficulty with which the government has in determining the optimum output level. If a survey is taken, consumers may overstate their value of the good if they are trying to make the government produce more of it, or they may understate their value of the good if they suspect that their valuation of the good will be used as the basis for a tax imposed on them in future.

Next, it is difficult to ensure that government provision is will be efficient. If the government hires an electric company to stall street lighting for instance, the company may be wasteful in its method of production since its costs are borne by the government.

Thus although public goods are ideally provided for by the government, fundamental problems with government provision do exist.

The public also requires reliable health services and education. Such goods are viewed as merit goods which are seen to be beneficial to individuals as well as to others in society.

Merit goods are often goods with positive externalities, as such the marginal social benefit(MSB) of producing or consuming them is greater than the marginal private benefit(MPB). However in a free market, the output level of goods are determined by the intersection of the marginal cost (MC) and MPB curves, MC being the price of the good and MPB being the extra satisfaction acquired from consuming an additional unit of the good.

As a result the equilibrium price is Pp and equilibrium output Qp. This level of output is viewed by the government as lower than desired, Qs being the socially-optimal level of output. As can be seen from figure 2, a deadweight loss to society of the shaded area is generated from underproduction of merit goods.

Photobucket - Video and Image Hosting

Education for example benefits an individual in terms of his wage rate and perhaps other personal benefits like self-esteem. To the society however, education helps to improve productivity of labour hence economic growth, as well as development of more civic-minded and mature citizens. Such external benefits, measured by the vertical distance between the MPB and MSB curves (the length EB in figure2), are not taken into account by the free markets.

Government regulation may help to increase the production of such merit goods. For example, the government subsidizes certain vaccinations for diseases like Hepatitis B. In addition, primary education is made compulsory in certain countries.

It is then, desirable that merit goods are provided by the government. Here again, certain problems arise with government provision. Firstly, what are merit goods? Such is a value judgement made by the government which may not be acceptable to everyone in the society.

Next, what is the extent to which the government should regulate the provision of merit goods? It is difficult to measure accurately in nominal terms the external benefits, since they are the benefits to those not involved in production or consumption of the good.

Lastly, government regulation may not be the best production of merit goods. It is not simply health services or education that is desired, but quality health services and education. If the government can only ensure shabby merit goods, the public is almost better off without them.

Since merit goods are private goods, it is feasible that the free market provides them. Private hospitals, for example, provide excellent healthcare services.

Hence one must note that government regulation should be flexible, with stricter rules set on basic healthcare and education and more lax ones, such as simple campaigns for fitness, to allow freedom of choice. It should also allow for the free market to provide for such goods, with certain government interventions like subsidies to encourage production and consumption of merit goods.

In conclusion, government regulation with respect to provision of public and merit goods is necessary, especially for public goods, but it should not take over the role of the free market ultimately.

A recent Economist magazine reported that the United States' current account deficit is $2 billion a day.

a. Are current account deficits a serious economic problem? [10]

b. Evaluate the strategies that can be used to correct current account deficits. [15]


A current account refers to the income and expenditure of the country on current purchases of goods and services. It is made up of 2 components, the import and export of merchandise goods and import and export of invisibles, including unilateral transfers which refers to transfer of funds not due to exchange of goods and services such as overseas aid. The current account is the sum of visible trade balance (value of visible exports-value of visible imports) and invisible balance (value of invisible exports-value of invisible imports). Invisibles include services rendered to or received from foreigners and dividends paid to or received from foreigners for investment here or overseas.

A temporary current account deficit may not be a big problem. If it is due to the import of capital equipment or foreign expertise in order to promote economic growth, the deficit now can result in a future stream of income into the country and is good.

However, if current account deficits are persistent, then they are bad for the country. Firstly, this may lead to a depletion of foreign reserves which are used to buy imports. This reduces the country’s ability to buy imports in the future. The country also has to borrow to cover up the deficit and will face the increased burden of having to pay them back. It also lowers the confidence of investors in the country. This is because the domestic currency may devalue without enough reserves to set it at the same price so investments in the country denominated in domestic currency will fall in price. This discourages local and foreign investors which will lower the level of investments, leading to capital flight and a decrease in aggregate expenditure (AE) which is the planned spending on all output and results in a downward shift of AE leading to a recession due to the multiplier effect which reduces national income and employment.

From the graph, the decrease in AE leads to a greater than proportionate decrease in national income, leading to lower welfare for the people. Stocks and shares can also crash, leading to destruction of wealth and bankruptcy. However all these problems will not exist if the capital account surplus out the current account deficit and there will not be an outflow of foreign currencies in this case. We need to examine the reason for the current account deficit. If it is due to lower exports as a result of higher price thus uncompetitive and increased imports as they are cheaper, this reduces (exports-imports) , a component of AE, which causes the multiplier effect.

Photobucket - Video and Image Hosting

There are some strategies to correct current account deficits.

In the short term, the country can run down its gold and foreign reserves to cover it, or to borrow from the International Monetary Fund and other Central Banks. In the long run, the government can also encourage exports by giving grants , loans or tax incentives to producers to lower their cost of production, resulting in a larger output at a lower price. It can also assist in research and development work to find new and more efficient production methods. All these will make exports more competitive and probably increase the demand for exports. This works only if exports are price elastic, in which case the decrease in price leads to a greater than proportionate increase in quantity demanded and increase foreign earnings.
In the short run, the government can also use expenditure switching or expenditure reducing policies. In government reducing policies, the government can employ contractionary monetary or fiscal policies by reducing government expenditure, increase taxes or reduce the money supply to raise interest rate, lowering the level of AE leading to lower income and price. This reduces the demand for imports. This is used when inflation causes the deficit. The exports will also look cheaper in terms of foreign currency so demand for exports rise. Locals will also switch consumption to local goods.

However this will only work if the price elasticity of demand and supply of exports and imports are elastic. It can also result in lower income and higher unemployment. There may also be retaliation by trading partners leading to lower volume of exports. The wages may not be lowered if there is strong resistance from trade unions.

In government switching policies, the government can install trade barriers such as tariffs and quota to make imports less attractive by increasing their price so demand for them drops. However this will not work if the foreign producer’s goods are price inelastic or if he chooses to absorb most of the tax, resulting in little change in import volume. There may also be retaliation by trading partners. It also results in a misallocation of resources which destroys the benefits of trade. Consumers are also denied cheaper imports. Domestic producers may also become complacent and inefficient.

The government may also do devaluation, which is a public announcement to decrease the exchange rate of the currency, if it believes that the currency is overvalued. It hopes that this will increase demand for exports as they are cheaper in terms of foreign currencies and thus more competitive. It can also reduce the demand of imports due to the increased price in terms of domestic currency, switching consumption to local substitutes. However this will work only if the Marshall-Lerner Condition is matched The sum of price elasticity of demand of exports and imports must exceed 1 so it results in a fall in import expenditure and a rise in export earnings. In the short run, the price elasticities of demand for both are likely to be inelastic as contracts have been made long ago. Thus current account deficits will occur in the short run. The price elasticity of supply of exports and imports must also be elastic so that domestic supply of exports can increase in response to increased demand by allocating resources to it to prevent price from increasing which will occur if the supply of exports is inelastic, which increases price thus forgoing the benefits of devaluation. Supply of imports must also be elastic or they will not be able to decrease supply which remains high, so prices remain low, devaluation will not help then.

There must also be no imported inflation, which can result if the country is heavily dependent on imported foodstuff and raw materials. The increase in import price can thus lead to a general increase in units and prices. There may be a wage spiral as cost of living increases. There must also be no devaluation by trading partners which will result in competitive devaluation. There must also be no loss of confidence in the economy since the value of assets denominated in local currency falls. If foreign investors lose hope, they will take their capital out of the country. If they expected a further devaluation, this can lead to a great outflow of short term and long term capital, leading to capital flight. This will put more pressure on the currency and cause the balance of payment of the country to worsen. Thus the different strategies to correct current account deficits works only sometimes. They may also affect other components of the balance of payments adversely so it depends on the situation if we want to see whether they are worthwhile.

Do you think monetary policy alone is sufficient to achieve a low rate of inflation? (25)

Monetary policy (MP) is the policy that involves the control of money supply (MS) that will affect interest rates, thus affecting the level of investment and affecting aggregate expenditure (AE), which eventually affects the equilibrium income of the economy. This chain effect can be illustrated using the diagrams below.

Photobucket - Video and Image Hosting

The central bank decreases MS from MS to MS1 thus increasing the interest rates from oi0 to oi1. With the increase in interest rates, the level of investment (I) reduces from oI0 to oI1 and this decrease in I lowers AE and if the economy is at full employment at oY1, then the decrease in AE will close the inflationary gap.

However, the MP works only assuming that the demand for money is inelastic and investment is interest elastic. If the demand for money is elastic, the decrease in MS will only lead to a small increase in interest rates that may be too small to affect investment and eventually the equilibrium NY of the economy. Moreover, if investment is interest inelastic, an increase in interest rates will not lead to a substantial decrease in the level of investment, thus not able to affect AE.

An increase in interest rates may also help reduce households’ consumption (C) because if interest rates are too high, consumers may not want to borrow to spend, as they would have to pay back even more. However, this would not be a problem if consumption were dependent on disposable income (Yd) rather than interest rates. Hence MP alone is not sufficient to achieve low rate of inflation and there are other policies like fiscal policy (FP), which can help achieve a low rate of inflation.

FP is the measure taken by the government to either increase or decrease AE and to lower inflation rates, contractionary policy is used. Contractionary FP would include either increasing taxes (T) or decreasing government spending (G).

By increasing T, the amount of Yd of households is lowered and thus they will decrease C, which will lead to a decrease in AE and a decrease in equilibrium NY through the multiplier.

Decreasing G has the same effect as T. Between increasing T and decreasing G, decreasing G would be a more certain policy of the 2 because an increase in T may not necessarily lead to a fall in C especially if consumers are no affected by tax increases. Decreasing G may decrease AE more effectively than decreasing MS given the uncertain impact on interest rates and I.

The increase in interest rates, decreasing G and increasing T are policies that will only work if the inflation is one that is a demand-pull inflation. Since these policies are followed by unemployment and a cost-push inflation is also followed by a recession, these policies will only worsen the recession and hence inappropriate for cost-push inflation.

Cost-push inflation occurs when there is an increase in the cost of production e.g. unions asking for higher wages for their workers, increase in the price of raw materials, which will increase the average total cost of the firm.

This kind of inflation would require supply side policies to lower the inflation rate. Short-term supply side policies include wage-price controls where wage and price increases may be frozen or capped. However, such policies are difficult to implement because it would require the firm to earn less profits, which not many are willing. In addition, there is a huge cost in implementing and monitoring the controls. The controls also lead to misallocation of resources.

Therefore long-term supply side policies are a much better way in lowering inflation caused by cost-push. These policies include increasing education and skills training that will in turn increase the productivity of the workers, which equate to larger output. Long-term supply side policies potentially shift out the production possibility curve, which is what the economy wants to achieve. Another long-term policy would be to encourage investment in the country. This can be done through the government giving tax incentives so that more firms will be willing to invest. Investment in the long term would lead to increase in output thus increasing NY.

MP may be a way to achieve low rates of inflation but it is not the only way as there is also FP in the form of decreasing G that can achieve the same effects but more certain impact. The type of inflation should be in mind also because MP and FP only works if inflation is demand-pull inflation and solutions to cost-push inflation would require long term supply side policies.